Interactive Dashboards
Create intuitive, real-time dashboards that present critical metrics at a glance. Customize layouts, filters and visual widgets to explore trends and monitor performance indicators relevant to your team’s objectives.
Create intuitive, real-time dashboards that present critical metrics at a glance. Customize layouts, filters and visual widgets to explore trends and monitor performance indicators relevant to your team’s objectives.
Meet the professionals dedicated to turning your data into strategictreasure. Our multidisciplinary team combines domain knowledge with technical proficiency to deliver impactful analytics.

With over a decade of experience in analytics leadership, Takashi oversees solution design and ensures data quality standards align with client objectives.

Yumi specializes in stakeholder collaboration, crafting tailored analysis frameworks and guiding clients through interpretive workshops.

Kenta designs and maintains robust data pipelines, integrating diverse sources and ensuring reliable access for reporting and visualization.
Our suite of analytics capabilities provides end-to-end support, from data integration and modeling to interactive reporting and trend monitoring.
Design dashboards with drag-and-drop components, enabling teams to view essential metrics and drill down into underlying data for detailed analysis.
See All FeaturesImplement statistical and algorithmic techniques to identify patterns in historical data and project potential future scenarios with clarity.
See All FeaturesSchedule regular report generation and distribution, ensuring stakeholders receive up-to-date insights without manual intervention.
See All FeaturesConnect databases, spreadsheets and cloud services into a unified environment, enabling comprehensive analysis across disparate information sources.
See All FeaturesUse data-driven predictions to guide next steps with confidence

By applying historical data models, organizations can uncover patterns that may signal shifts in customer behavior, operational capacity, or market dynamics. BizInsightNow employs algorithmic techniques to parse large data sets and surface trends that inform decisions on resource allocation and project prioritization.
Explore Predictive Tools →
Rigorous scenario analysis helps anticipate potential obstacles and operational challenges before they arise. Our analytic frameworks evaluate multiple variables simultaneously to highlight areas of vulnerability, enabling teams to craft targeted strategies for reducing exposure and maintaining steady performance.
Explore Predictive Tools →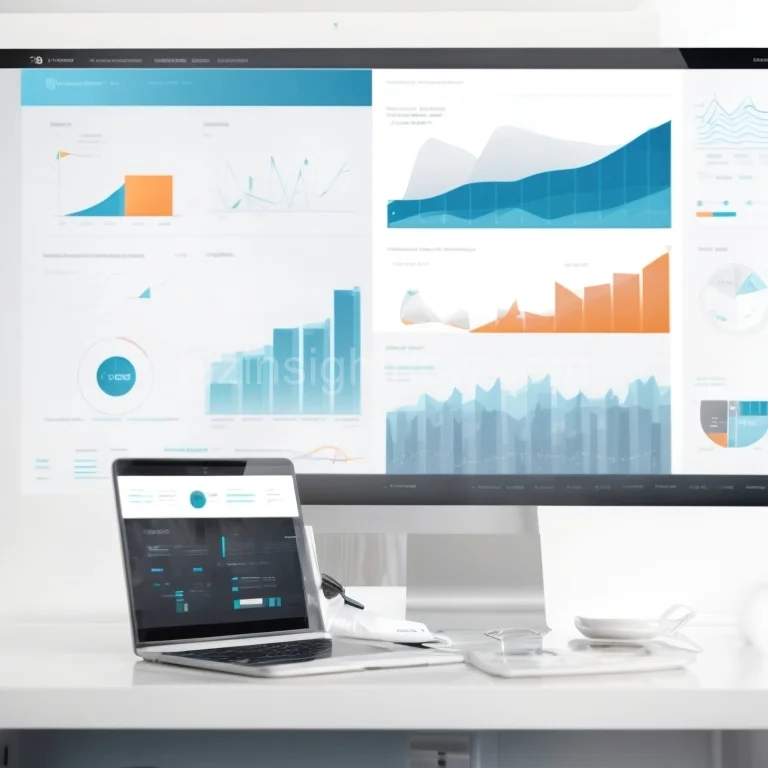
Simulating diverse business scenarios allows stakeholders to test the impact of various strategic options without real-world cost. With interactive models from BizInsightNow, you can adjust key parameters in real time and observe projected outcomes under different conditions.
Explore Predictive Tools →Effective analytics begins with clean, consistent data. At BizInsightNow, we implement validation rules and automated checks to ensure that incoming information meets predefined standards before it enters your analytic environment.
Our work includes deduplication, error correction, and normalization processes that reduce noise and improve the reliability of downstream analysis. This foundation supports more accurate forecasting and performance monitoring.
Interesting Fact: Studies show that high data quality can reduce operational inefficiencies by up to 30%, leading to better transparency across cross-functional teams.
Presenting insights in a clear, intuitive format helps teams grasp complex information quickly. We use modern visualization libraries to craft interactive charts and maps that highlight the most relevant metrics.
Insights are only valuable when they drive informed decisions. Our consultants deliver concise summaries and recommended next steps, ensuring teams can act on findings without delay.


Join leading organizations in Japan that leverage BizInsightNow’s analytical expertise to transform raw information into clear, actionable planning. Reach out to schedule a consultation tailored to your operational needs.
Get Started